A Deep Dive into Critical Values: Types and Calculations

The critical value serves as a boundary that defines a specific range where the test statistic acquired during hypothesis testing, is improbable to lie within. The critical value is a benchmark against which the obtained test statistic is compared during hypothesis testing. This comparison helps in deciding whether to reject the null hypothesis or not.
On a graph, the critical value explains the boundary between the acceptance and rejection areas in hypothesis testing. It aids in judging the statistical importance or significance of a test statistic. This article will explain the following fundamental concepts of critical value:
What is?
Formulas to calculate
Types of Critical Value
Steps to calculate
Examples of Critical value
Summary
Defining Critical Value:
A critical value is a specific test statistic value that establishes a confidence interval’s limits (upper and lower). It also sets the threshold for determining statistical significance in a statistical test. It indicates the distance away from the average (mean) of the distribution needed to comprehend a particular portion of the overall variation in the data (Such as 90%, 95%, or 99%).
The Formula Used to Find the Critical value:
The formula for determining critical values varies depending on the statistical test or distribution being used. While there's no universal formula for critical values, their calculation involves these key factors:
Type of hypothesis test: Z-test, t-test, chi-square test, F-test, etc.
Level of significance (α): Typically, 0.05 or 0.01.
Tailed Ness of the test: One-tailed or two-tailed.
Degrees of freedom (df): Often needed for t-tests, chi-square tests, and F-tests.
Confidence Interval in Critical Values:
The critical values for both 1-tailed and 2-tailed tests can be determined using the confidence interval. The process to calculate the critical value is as follows:
Deduct the confidence level from 100%.
Change this value into decimal form to obtain α (alpha).
If the test is 1-tailed, the alpha level remains the same as in step 2. However, for a 2-tailed test, α level is divided by 2.
The critical value can be determined by consulting the relevant distribution table, based on the type of test and the alpha value.
Basic Types of Critical Value:
There are various types of critical values used in statistical analysis, which depend on the nature of the test and the distribution being considered. Some of the common types include:
Z-Score Critical Values
T-Score Critical Values
χ² (Chi-Square) Critical Values
F-Statistic Critical Values
Z-Score Critical Values:
Used in hypothesis testing for population means when the population standard deviation is known. Z-scores correspond to specific percentiles of the standard normal distribution.
Specify the alpha level.
Compute 1 minus the α level to derive the adjusted value for a 2-tailed test. Deduct the alpha level from 0.5 in the case of a 1-tailed test.
Use the z distribution table to find the area and obtain the z critical value. In the case of a left-tailed test, include a negative sign to the critical value after obtaining it.
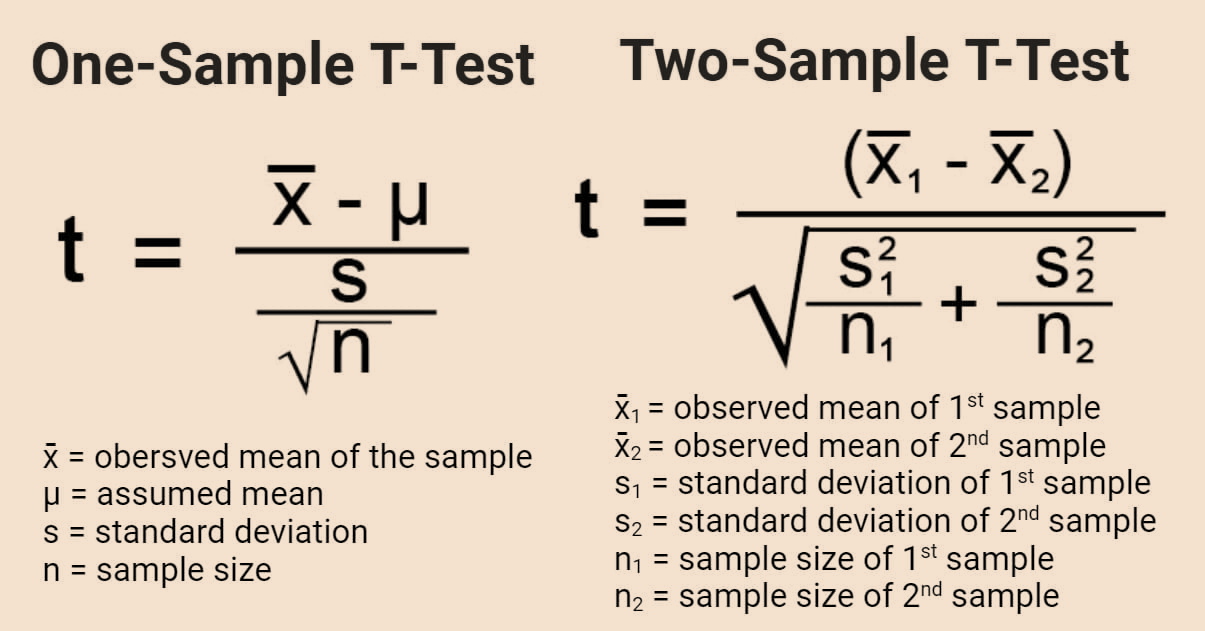
T-Score Critical Values:
Used in hypothesis testing for population means when we don't know the population standard deviation and have a small sample size. T-scores come from the t-distribution and vary based on the degrees of freedom.
Fix the alpha value to evaluate the test’s significance.
Subtracting 1 from the sample size yields the degrees of freedom (df).
Use the one-tailed t-distribution table if the hypothesis test is one-sided. Utilize the two-tailed t-distribution table for a two-sided test.
Locate the t critical value by identifying the cell where the row for degrees of freedom (df) and the column for the alpha level intersect in the table.
χ² (Chi-Square) Critical Values:
Used in chi-square tests for independence or goodness of fit. Chi-square critical values are based on the chi-square distribution and depend on the degrees of freedom and the chosen level of significance.
Calculate the degrees of freedom for the Chi-Square distribution.
Choose the significance level (α).
Refer to the Chi-Square distribution table.
Locate the critical value corresponding to the degrees of freedom and chosen significance level.
F-Statistic Critical Values:
Utilized in ANOVA (Analysis of Variance) tests to compare variances between multiple groups. F-statistic critical values are taken from the F-distribution and depend on the degrees of freedom of the groups being compared.
Compute the alpha level.
Deduct one from the size of the initial sample to get the degree of freedom. Denoted as X.
Deduct one from the second sample to determine the 2nd Degree (df) of freedom. Labeled as y.
Consult the F distribution table, locating the value where the column representing x intersects with the row representing y. This intersection provides the F critical value necessary for the analysis.
Examples Highlighting the Importance of Critical Values:
Example 1: Chi-Square Critical Value Calculation
Suppose you're conducting a chi-square test to analyze the independence between two categorical variables in a survey. Your contingency table has 3 rows and 4 columns.
Solution:
Calculate Degrees of Freedom (df):
For a chi-square test of independence, degrees of freedom (df) are computed as:
df = (Number of rows - 1) * (Number of columns - 1)
df = (3 - 1) * (4 - 1)
df = 2 * 3 = 6
Choose Significance Level (α):
Suppose we are working with a significance level at α = 0.05, which is commonly used in hypothesis testing.
Refer to Chi-Square Distribution Table:
Consult the Chi-Square distribution table with 6 degrees of freedom and α = 0.05.
Locate Critical Value:
Find the critical value for 6 degrees of freedom at α = 0.05 in the Chi-Square distribution table.
Chi-square Distribution Table
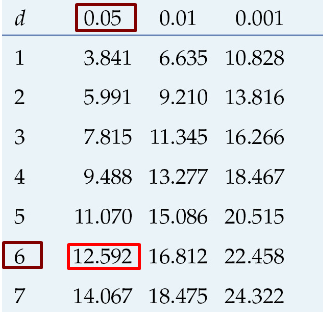
Critical Value = χ² = 12.592 (df=6, α=0.05)
Suppose we're conducting a hypothesis test to determine if the average IQ of a population is significantly different from a claimed mean IQ of 100, with a population standard deviation known to be 15. We'll perform a two-tailed test at a significance level (α) of 0.21.
Specify the alpha level: α = 0.21 (significance level)
Compute 1 minus the alpha level for a two-tailed test: For a two-tailed test, the adjusted alpha level is
1 - α = 1 - 0.21 = 0.79.
Use the Z-distribution table to find the critical Z-value:
Therefore, the critical Z-score for a two-tailed test is approximately ± 0.81.

Summary
This article explored the essential concept of critical values in hypothesis testing. We understood their role in defining boundaries for the test statistic and judging its statistical significance. We delved into the formulas and steps for calculating critical values for various scenarios like Z-tests, T-tests, and Chi-Square tests. We examined different types of critical values and observed their application in practical examples.